
Processes and References Used for Family CCA
The objective of this tool is to transform everyday habits into quantitative data that allows visualization of the environmental impact and health risks within the home.
Scoring System
To standardize the responses, a scale of 1 to 3 points per question is used, where the value increases according to the intensity of the environmental impact or the health risk.
Section 1: Carbon Emissions (10 questions)
Question 1 (Population): Determine the multiplier factor of the total footprint.
Questions 2 to 10: * 1 point: Low impact (e.g., bicycle use, constant recycling).
2 points: Moderate impact (e.g., use of public transport, occasional meat consumption).
3 points: High impact (e.g., own car use, daily meat consumption, zero recycling).
Section 2: Health and Inner Quality (5 questions)
Questions 11 to 15: * 1 point: Zero or low risk (e.g., daily ventilation, no mold present).
2 points: Latent risk (e.g., occasional use of strong chemicals, partial ventilation).
3 points: Critical risk (e.g., smoking indoors, extensive presence of mold).
To obtain the percentages of the result circles, a linear normalization is used:
A. Percentage of CO₂ Footprint
It is based on the 9 habit questions (excluding the number of people question, which acts as a reference limit).
Calculation Formulas
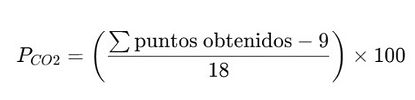
Where 9 is the minimum possible score and 18 is the range (27 max - 9 min).
B. Estimated Annual Tonnage
Apply the principle of proportionality to the maximum recommended limit:
The 15 tons is the maximum that a person could emit, so it is multiplied by the number of people to give a maximum number of tons per family.
C. Percentage of Health Risk
Where 5 is the minimum score and 10 is the range (15 max - 5 min).


Global Bar and Interface Design
The design is based on Color Psychology applied to Safety (ISO 3864) and Nudge Theory:
The Three-Color Stable Bar: Designed with fixed divisions (33% each) to help the user quickly identify their "danger zone." Unlike a smooth gradient, the clear divisions create a psychological sense of urgency when the marker crosses into the red block.
Visualization of Results: A Glassmorphism design (crystal effect) was chosen to convey modernity and transparency, key values in current sustainability.
Marker 📍: The use of a physical pin on the bar aims to make the user feel their position as a "geographical point" on their path to sustainability.
Project Sources (APA Citations)
To ensure the reliability of the limits and reference data, the following institutions were consulted:
World Bank. (2024). CO2 emissions (metric tons per capita). Open access data. Retrieved from https://datos.bancomundial.org
Global Footprint Network. (2023). National Footprint and Biocapacity Accounts. (Focus on biocapacity and absorption limits per person).
World Health Organization (WHO). (2021). Global guidelines on air quality. Geneva: WHO. Retrieved from https://www.who.int
Intergovernmental Panel on Climate Change (IPCC). (2022). Climate Change 2022: Mitigation of Climate Change. (Reference for transport and energy consumption factors).